Close Brothers Property Finance New Build House Price Index: Q2 2021
The New Build House Price Index: a quarterly report which provides bespoke, up-to-date information on the price of a new home in England and it’s nine regions, as well as comparing new build price variations with existing house prices and calculating the new homes premium.
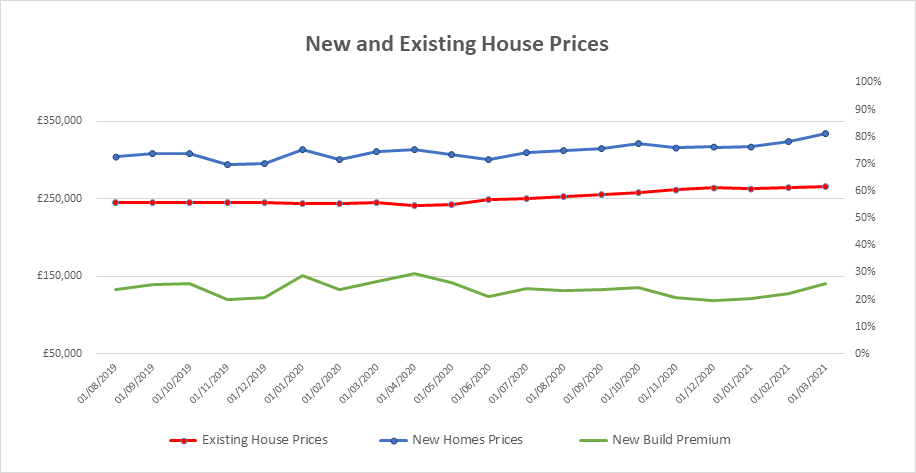
England in Q2 2021
- The new homes market remains strong with the average new house price in England rising 5% in Q2 to £352,863 – up 15% annually
- Existing house prices also remained buoyant, rising 6% in Q2 to £280,350 – up 15% annually
- The New Homes Premium (the premium price paid for new build properties compared to existing) stands at just over a quarter (26%) marginally down from Q1 (27%)
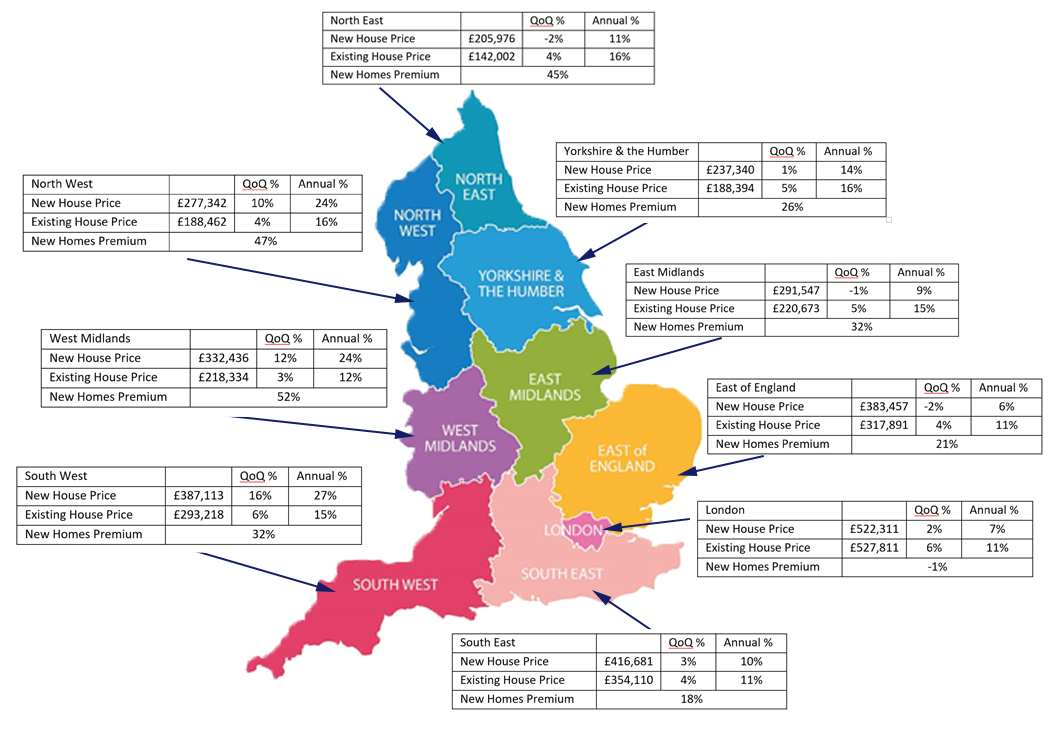
In the regions
New Homes Price Growth:
- The South West (+16% QoQ), West Midlands (+12% QoQ) and North West (+10%) have seen the strongest price growth for new homes – both quarterly and annually
- The East of England (-2%), North East (-2%) and East Midlands (-1%) saw marginal negative growth, but were still up by annually by 6%, 11% and 9% respectively


New Build Premium
- The West Midlands has the highest new build premium (52%) followed by the North West (47%) and then North East (45%)
- London is the only region to see negative growth in terms of the New Homes Premium (-1%)
Methodology
As this is a new report and resource, it is primarily designed for internal use across the following areas:
- Property and Risk Credit Committee
- Lender education and market insight
- As a tool for new business
The report is compiled using Land Registry figures (circa 170,000 new and existing sales per annum), however, this data has a three month lag, so while providing the most accurate depiction of the market, the three month delay means it’s not widely used.
To combat this, the Index uses Close Brothers Property Finance sales data alongside Nationwide’s housing market index to create a forecast which provides you with a unique, current set of figures - allowing you to see where the market is now, so you can more accurately forecast where it might be headed. The full methodology listed is below, with the Excel document available upon request.
This index uses the following data sets:
- Government (Land Registry (LR)) data which is released around the 21st of each month but has a three month reporting lag
- Close Brothers Property Finance (CBPF) data released on the 8th working day of the month reporting the previous month
- Nationwide UK and Regional House Price Index released within a few working days either side of the last day of the reporting month or quarter.
The index tracks and forecasts the sales price of new build homes (monthly (England), quarterly (regionally) and annually (both)) using the LR data and forecasting using the CBPF data. We also compare this to existing house price data to establish the ‘new build premium’. To find the premium we will use the price differential from the new homes price data (LR/CBPF combination) and existing house price (LR/Nationwide) and track the rate of change on a quarterly basis for England the regions.
England
To further increase the CBPF data’s statistical reliability for England’s prices, we have weighted the ave. price according to LR volume sales data from the regions. This has worked to further smooth the price volatility and address the regional inconsistency within the data (CBPF data is primarily weighted to SE where prices are higher), so now the trends are more in line with historic LR data. We have also applied a 2 month rolling average on the CBPF house prices to further smooth volatility for things like seasonal fluctuations etc
For the forecasting methodology, we then apply the month on month % price changes of the CBPF averaged, weighted house prices from the last three months to the most recent LR house price data, thus predicting the missing last three months of LR data. We will be able to accurately predict new homes sale price variations on a monthly basis, however, we only release this quarterly.
Existing House Price
The index will also include existing house price data which is released in the same LR ‘new build’ excel data and has the same three month lag. The three month forecast is modelled in a similar way as mentioned above, using Nationwide house price data to replace the CBPF month on month % changes. The Nationwide data is already is mix adjusted, seasonally adjusted and has a large representative sample, does not require any additional analysis. By forecasting the LR existing house price data, we can create a clear, current, price comparison between ‘new build’ and ‘existing’ house sales prices to calculate the new build premium.
New Homes Premium
The percentage difference between the LR forecast new homes sale price and LR forecast existing house price represents the premium afforded to newly built homes. This will be tracked quarterly across England and the regions. This premium and the tracking of this premium, is not currently reported by any institution and tracking this premium will be of great interest to the media and other industry stakeholders.
Regions
The methodology for the regions will follow the similar principles as above, however, the CBPF data will not be regionally weighted and will have a three month rolling average applied and we will be forecasting the quarterly price fluctuations. By reporting quarterly changes we are safeguarding against the unavoidable volatility of the data sets, given the smaller sample sizes, not mix adjusting the data and seasonality.
As above, the quarter on quarter % price changes of the CBPF data will be used to forecast the missing quarter of LR regional new homes sales price data. For existing house prices, we will use Nationwide’s regional quarterly house price index and apply the same quarterly % change methodology to the forecast.
Anna Geffert, Hera Communications